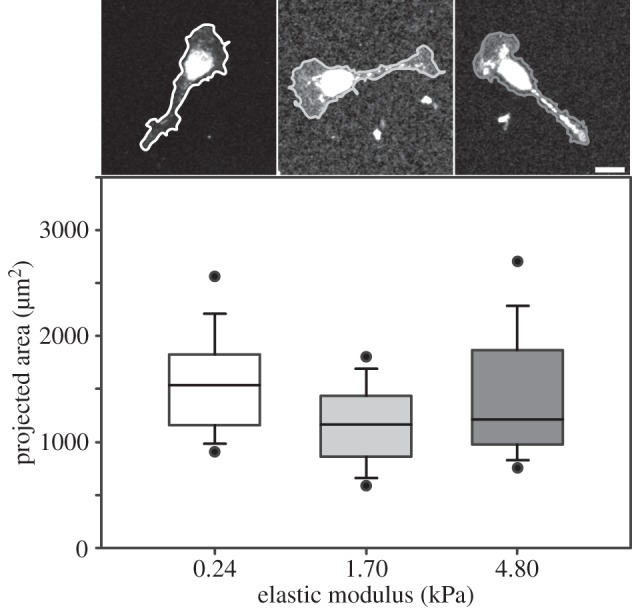
Figure 3.

SC spreading area was similar across elastic moduli. Box and whiskers plot of SC spreading area for the three tested elastic moduli; 0.24 (n = 143), 1.70 (n = 252) and 4.80 kPa (n = 120). Solid bands: medians, top and bottom boxes: upper and lower quartiles, whiskers: standard deviations, and dots: fifth and 95th percentiles. Representative confocal micrographs of SCs for each elastic modulus are shown. Scale bar represents 20 µm.
