Figure 4.
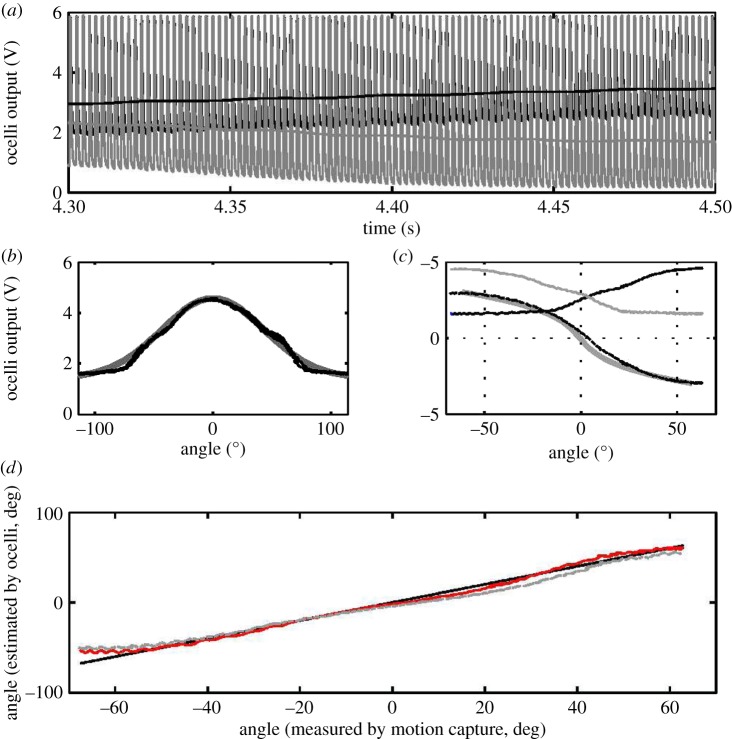
Calibration of the ocelli-inspired visual sensor. (a) Voltage readings y2 (black) and y4 (grey) from an opposing pair of phototransistors, before filtering (the effects of the one-eighth duty cycle, 500 Hz infrared flashes of the motion capture cameras can be seen as spikes followed by a short transient decay) and after (smooth trace showing trend), taken during a calibration in which the robotic fly was held by tweezers as it was rotated by hand in the motion capture arena. (b) To measure the approximate acceptance profile  of the phototransistor, it was rotated under the fibre-optic light source, approximately a point source. The response spans a range of approximately 160° (black) and resembles a Gaussian function with σ = 61° (thick grey line, fit performed by fminsearch). (c) y2 (black), y4 (grey) and yb = y4 − y2 (dashed), plotted against measurements from the motion capture system. The slope of this line at zero angle corresponds to k in equation (4.7). A third-order polynomial fit of angle θ2 to yb using the Matlab command polyfit is shown (thick grey line). (d) This polynomial was used to estimate θ2 from the ocelli responses at θ1 = 0 (red) compared with the estimate from motion capture (black) and shows a close correspondence for the range of ±60°. If the ocelli are inclined about the other axis at θ1 ≈ 30°, the estimate is not significantly perturbed (dashed grey line). (Online version in colour.)

