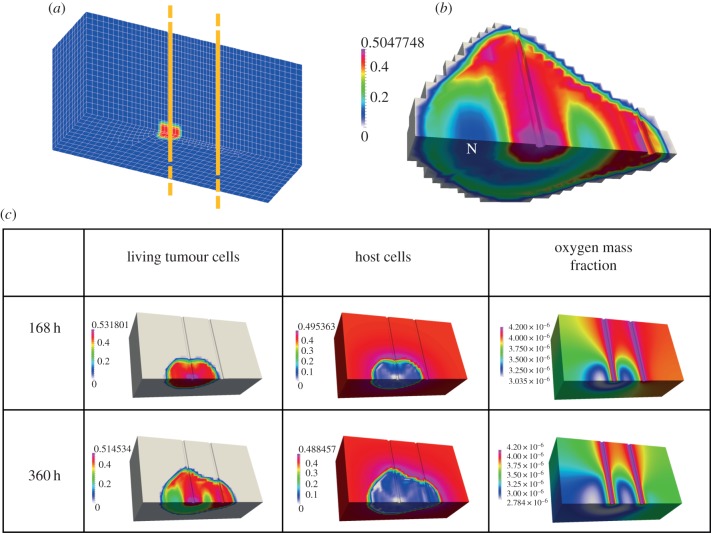
Figure 12.
(a) Geometry; yellow lines show the axes of the two capillary vessels. (b) Volume fractions of the living tumour cells at 20 days; ‘N’ indicates the necrotic areas. (c) Volume fractions of the living tumour cells (first column) of the healthy cells (second column) and mass fraction of oxygen (third column) [132].

