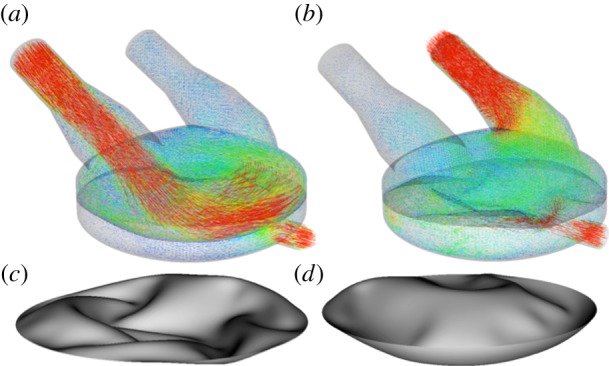
Figure 16.

Top: snapshots of the blood flow velocity during the fill (a) and eject (b) stages of the PVAD operation. Bottom: snapshots of the deformed configuration of the thin structural membrane during the fill (c) and eject (d) stages of the PVAD operation. The FSI simulations shown are from [168].
