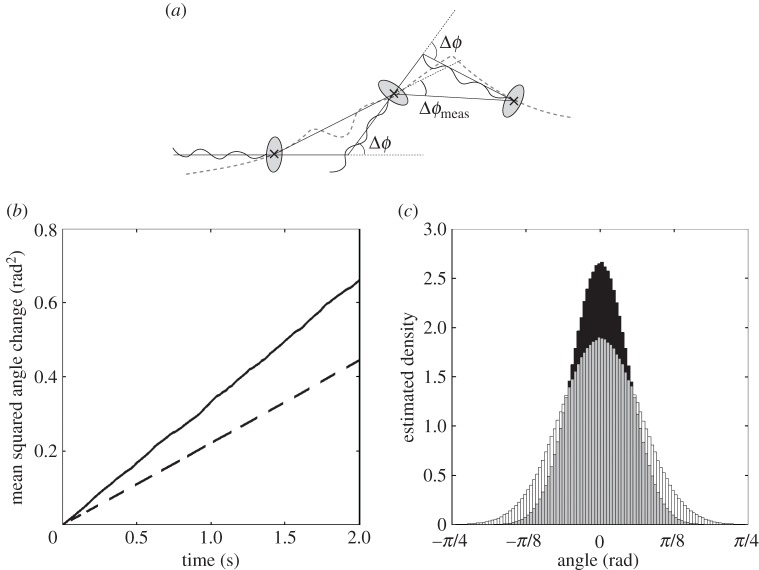
Figure 5.
(a) Illustration of the difference between the true underlying angle change, Δϕ, and the measured angle change, Δϕmeas, of a swimming bacterium. The grey dashed line denotes the true trajectory of the bacterium. (b) The observed MSAC over time for simulated tracks. Angle change computed using the true underlying orientation of the simulated particles (solid line), and angle change computed by estimating the angle change from particle positions (dashed line). (c) Histograms of the measured angle changes, Δϕmeas, of simulated particles in the run-only model for different values of the sampling time-step τ. τ = 0.1 s (black); τ = 0.2 s (white).

