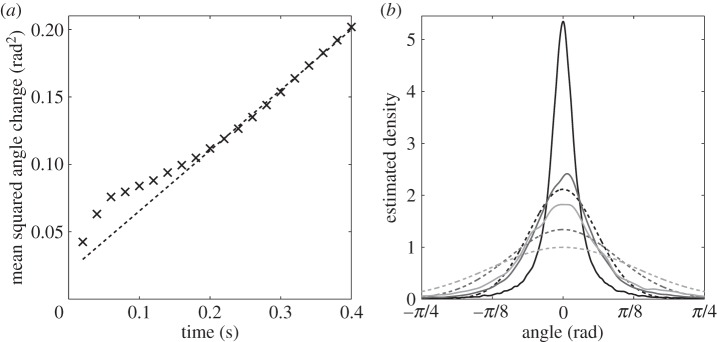
Figure 8.

Extracting characteristics of noise from the R. sphaeroides non-chemotactic dataset obtained by Rosser et al. [18]. (a) The observed MSAC (black crosses) with linear fit (dashed line). The slope of the fit is 0.255 rad2 s−1. (b) The estimated PDF of angle changes (solid line), overlaid with the wrapped normal distribution with variance computed from the data (dashed line). The three shades denote different values for the sampling interval, τ. Black: τ = 0.02 s; dark grey: τ = 0.1 s; light grey: τ = 0.2 s.
