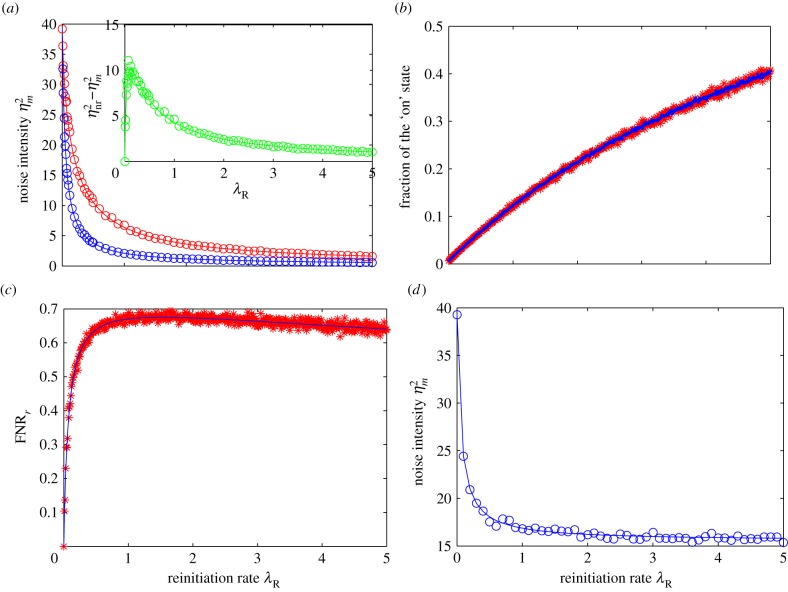
Figure 2.
The influence of the reinitiation rate. The parameters are set as λS = 5, λI = 0.05, λR ranges from 0 to 5, λA = 0.1, and μ = 10. The meaning of each parameter is indicated in figure 1, and all of them are normalized by the mRNA degradation rate δ. In (a,d), the solid lines are theoretical values, whereas the circles give the simulation values. (a) The blue line (circles) shows the noise intensity under different reinitiation rates, whereas the red line (circles) shows the noise intensity in an equivalent model without reinitiation; the inset (green line/circles) shows the difference of the noise intensity between these two models (b). The simulation results for the fraction of the ‘on’ state, plotted for both the reinitiation model (blue) and its equivalent non-reinitiation model (red) with respect to the reinitiation rate; (c) the quantitative contribution of reinitiation, FNRr, with respect to the reinitiation rate, where the blue solid line is the theoretical plot, and the red stars are simulation results; (d) the influence of the reinitiation rate on the transcription noise intensity at a constant transcription level. When the reinitiation rate increases, the stability of the active state is decreased to keep the transcription level constant.

