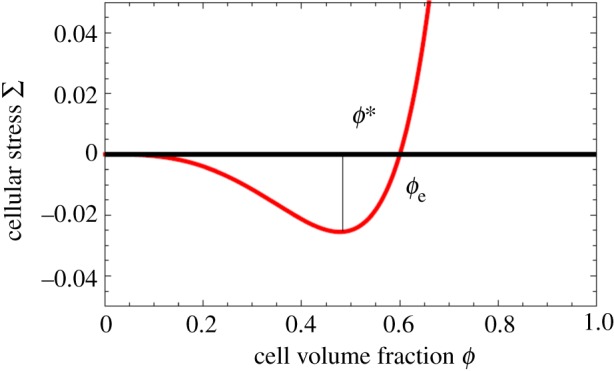
Figure 3.

∑, derivative of the free-energy as a function of concentration, f(ϕc) representing the attraction between melanocytic cells. ϕe is the concentration at equilibrium with the surrounding tissue.

∑, derivative of the free-energy as a function of concentration, f(ϕc) representing the attraction between melanocytic cells. ϕe is the concentration at equilibrium with the surrounding tissue.