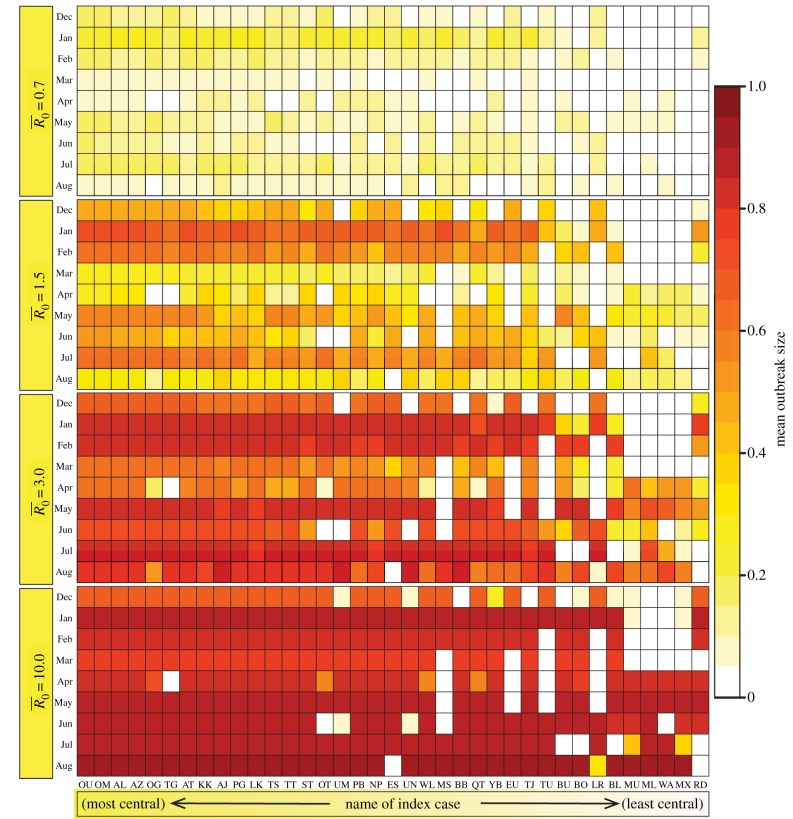
Figure 1.
Mean outbreak size as a function of index case, month of initial case and pathogen contagiousness  . The colour of each cell shows the average proportion of the chimpanzee community (n = 37) that was infected across the 1000 replicates per unique combination of parameters. The x-axis shows the identities of the index cases, ordered from highest to lowest mean weighted degree centrality (i.e. averaged across months).

