
Figure 3.
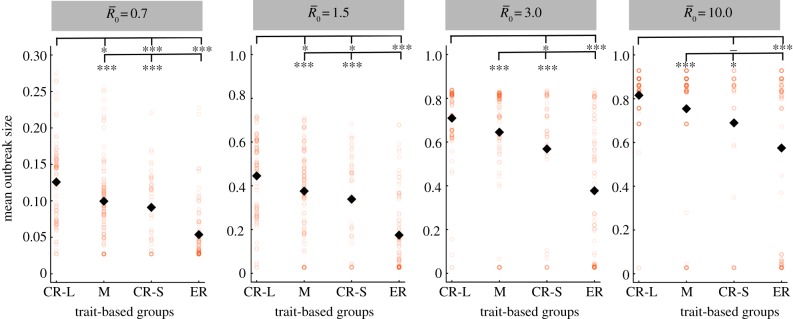
Mean outbreak size for index case trait-based groups across different values of pathogen infectiousness  . Mean outbreak size is shown as a proportion of the whole community, and trait-based groups are abbreviated as follows: CR-L, core-ranging individuals with large families; M, adult males; CR-S, core-ranging individuals with small families; ER, edge-ranging individuals. Open circles show outbreak size averaged across 1000 simulations per unique combination of monthly network and index case for a given
  . Black diamonds mark the mean outbreak size averaged across each trait-based group. Note the different y-axis scale for the first panel
  . Significant relationships are indicated after Bonferroni correction as follows: −p < 0.013, *p < 0.01, **p < 0.001, ***p < 0.0001. (Online version in colour.)