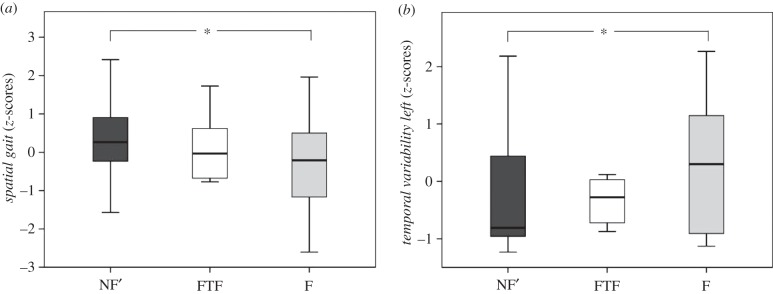
Figure 2.

Scores for spatial gait (a) and temporal variability, left (b) for the three patient groups NF’, FTF and F. While results for FTF are displayed, they were not considered in the regression analysis due to the unequal sample size. Asterisk (*) donates significance at p = 0.05.
