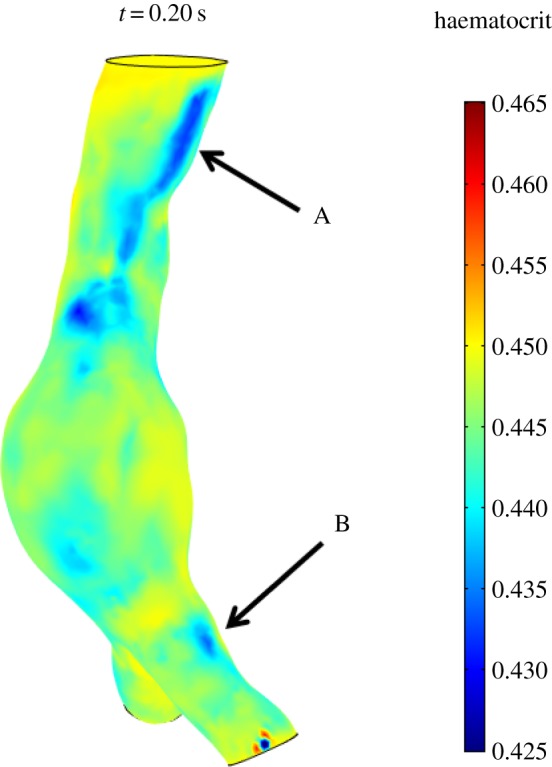
Figure 8.

Wall haematocrit in the fusiform aneurysm at t = 0.20 s. The aneurysmatic bulge presents an almost uniform haematocrit of around 0.45 while the proximal region of the aorta, on the inner curvature wall (arrow A), presents haematocrit values of around 0.43. Spots of decreased haematocrit are observed on the lateral-external wall of both iliac arteries throughout the cardiac cycle (arrow B).
