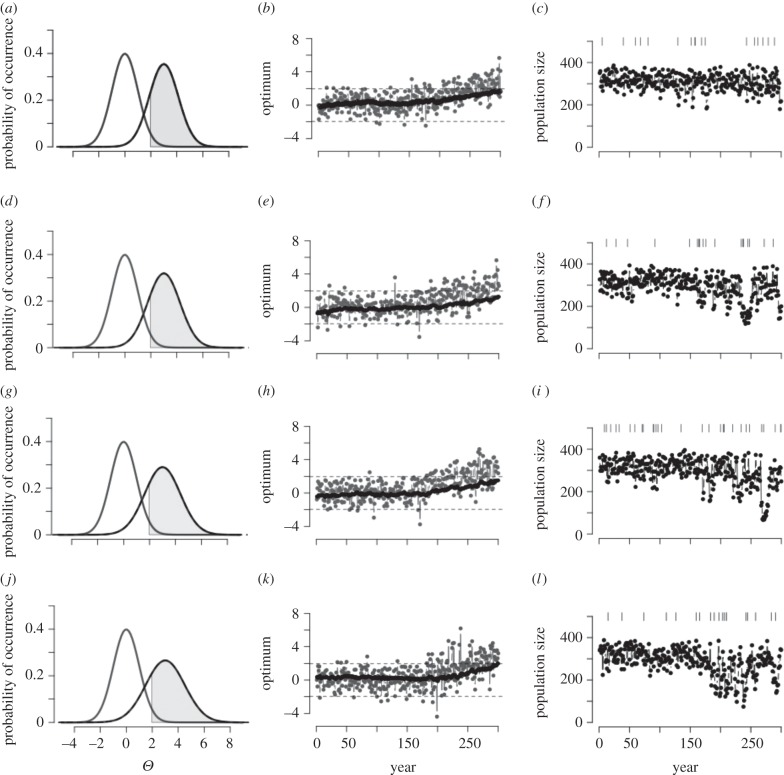
Figure 1.
Increase of the probability of extremes and consequences for evolution of a quantitative trait and population size over time. Increase in variability for 25 years after climate change βσ,Θ = 0.5 (a–c), 1.0 (d–f), 1.5 (g–i), 2.0 (j–l) × 10−2. For all rows, βμ,Θ = 2 × 10⁻². (a,d,g,j) Shift of the normal distribution of a climate variable (e.g. mean or maximum summer temperature) from year 1 (start of simulation time, grey line) to year 300 (end of simulation time, black line), with a directional increase of the mean of the distribution βμ,Θ and increase in the variability of the optimum from year 150 to year 175 (βσ,Θ). The grey region defines the events in the distribution of the climate variable at the end of simulation time that would be considered extreme events at t = 1 (e.g. in the right 2.5% of the distribution). (b,h,h,k) Example of change of the optimum phenotype Θ(t) through simulation time (grey) and change of the mean phenotype  (black). The dashed lines define the 95% central portion of the normal distribution of the climate variable at t = 1. (c,f,i,l) Population size though time with variation of the optimum phenotype as in (b,h,h,k). Vertical segments indicate point extreme events with p(Ea) = 7.5 × 10⁻².

