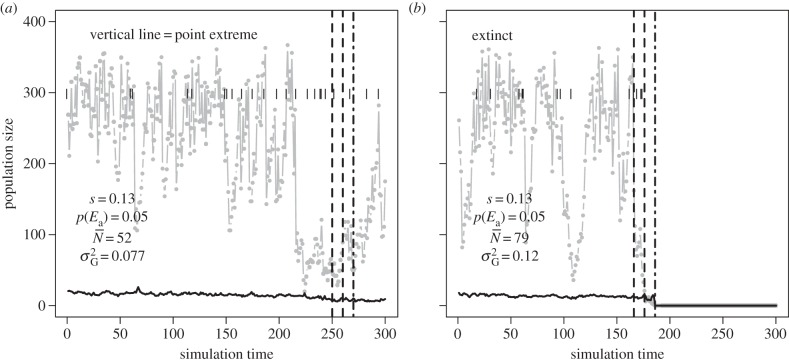
Figure 7.
Examples of wrong (a) and right (b) predictions of the GLM full model that predicts extinction in an ‘extinction window’ based on mean population size and additive genetic variance in a ‘sampling window’, along with strength of selection s and probability of point extreme p(Ea). For (a), risk of extinction as predicted by the GLM model is 0.92 (cut-off for binary assignment = 0.43, see the electronic supplementary material, figures S8 and S9), for (b) is 0.82. Black segments are point extremes, the black line is additive genetic variance multiplied by 100 for graphical purposes, the grey line and points represent population size. Between the two vertical dotted lines is the ‘sampling window’ and between the dotted line and the dotted-dashed line lays the ‘extinction window’. In each panel are reported strength of selection s, probability of occurrence of point extremes (p(Ea)), mean population size ( ) and mean additive genetic variance (
 ) in the ‘sampling window’.

