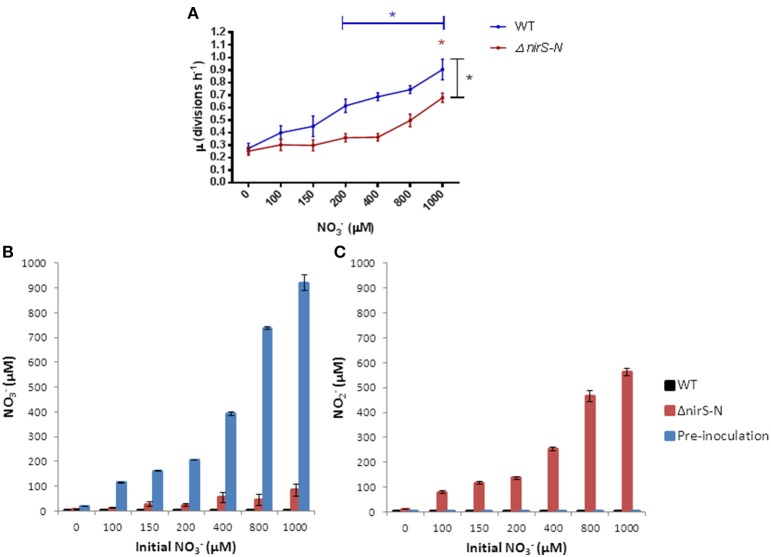
Figure 3.
(A) Specific growth rates (μ) of P. aeruginosa (WT and ΔnirS-N PAO1) grown in anoxic LB supplemented with NO−3. Mean ± s.e.m. of triplicate experiments, *p ≤ 0.05 Blue and red * indicate significant increase in μ from 0 μM calculated by One-Way ANOVA. Black * indicate significant difference (p = 0.0316) between conditions (≥400 μM) as calculated by Two-Way ANOVA. (B) NO−3 and (C) NO−2 content of anoxic sterile filtered growth media after 20 h.

