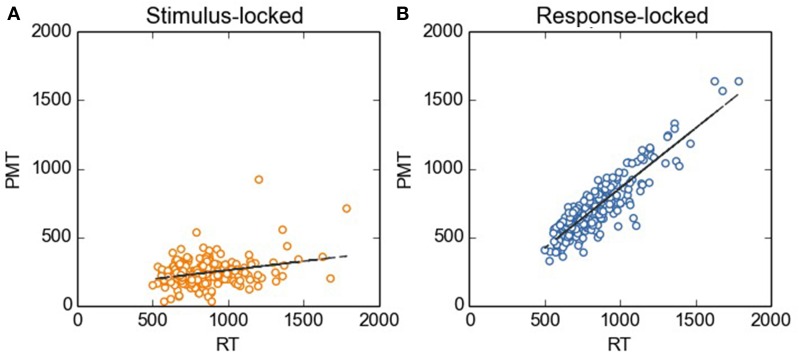
Figure 2.
Stimulus-locked (A) and response-locked (B) PMT as a function of RT. Before carrying out the regression analysis described in the main text, we removed the between-subjects variability by using the method as described by Cousineau (2005). For the sake of comparison, the scale on the y axis is kept constant across Figures.

