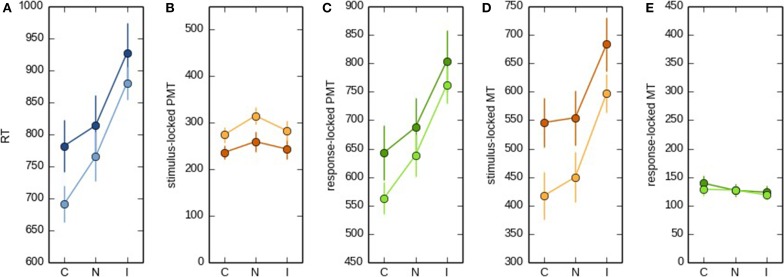
Figure 4.
RT (A), stimulus-locked (B) and response-locked PMT (C), and stimulus-locked (D) and response-locked MT (E) as a function of Stroop condition (congruent, neutral, or incongruent). The condition effects depicted by the dark lines are based on the selection of trials for which the difference between the two onset-detection approaches were maximal. The condition effects depicted by the light lines are based on the broader data set. For the sake of comparison, the scale on the y axis is kept constant across (B,C) and (D,E).

