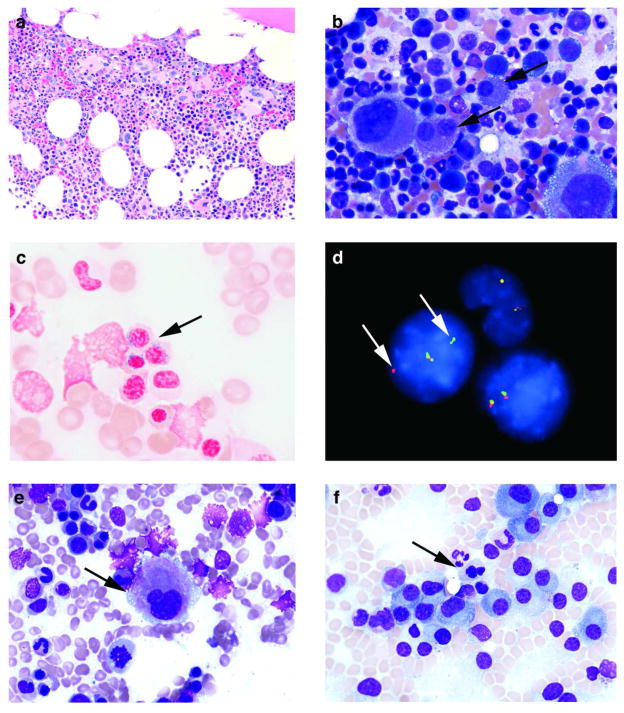
Figure 2.
Bone marrow morphology and FISH analysis in MM patients treated with LEN. (a) The biopsy from time of diagnosis of MDS in one patient from the LD alone group, 13 months after initiation of therapy, was hypercellular (60%) with loose clusters of megakaryocytes (Hematoxylin & Eosin, original magnification X200). (b) Severe dysmegakaryopoiesis, including forms with widely separated nuclei and rare micromegakaryocytes (arrows), were seen at diagnosis of MDS in the same patient as in panel (a) (Wright-Giemsa, original magnification X500). (c) Ring sideroblasts (arrow) were easily seen at diagnosis of MDS in the same patient as in panels (a and b) (Prussian blue, original magnification X1000). (d) FISH analysis performed on a bone marrow aspirate smear at diagnosis of MDS in the same patient as in panels (a–c), whose concurrent classical cytogenetic analysis revealed 46,XX,t(4;11)(q31;p15)[3]/46,XX[18]. There are two normal cells with two fusion signals and a third cell with one fusion signal and one separate orange and green signal each (arrows), which suggest a NUP98 gene rearrangement. (e) Mild dysmegakaryopoiesis, including this small form with a hypolobated nucleus (arrow), was seen in a patient from the LD alone group after 9 cycles of therapy (Wright-Giemsa, original magnification X500). (f) Mild dyserythropoiesis, including this normoblast with nuclear irregularity, budding and megaloblastoid changes (arrow), was seen in a pretreatment specimen from a patient assigned to the LD alone group (Wright-Giemsa, original magnification X500).

