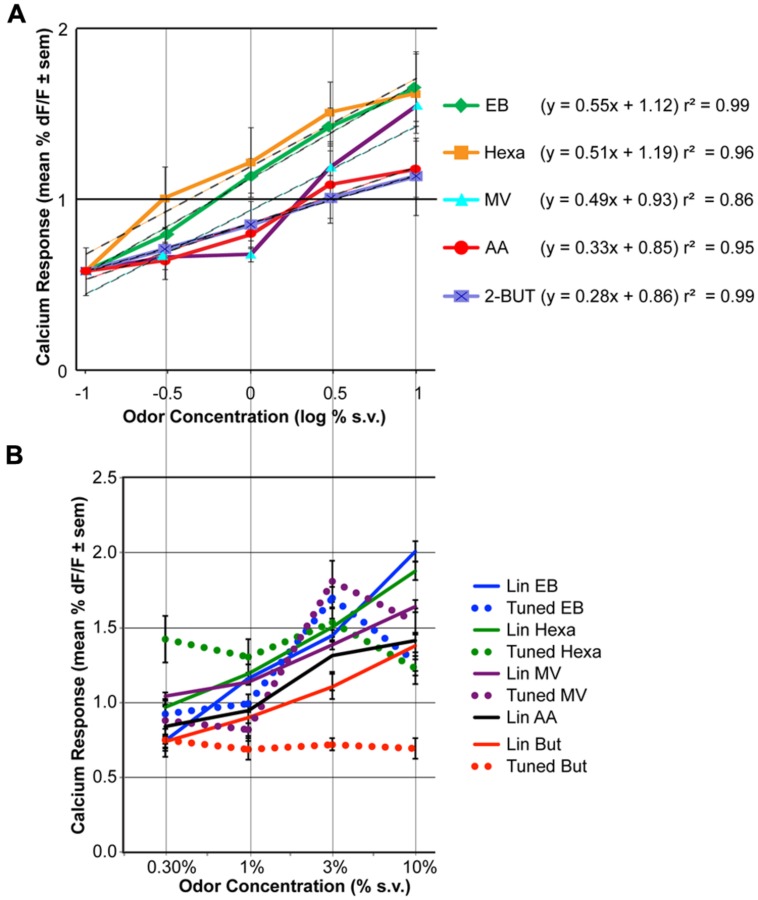
FIGURE 2.
The effect of odor concentration on glomerular response. (A) Average concentration-response curves for five odorants. For each odor the effect of concentration was statistically significant (ANOVA, P < 0.05, n = 9). Responses to clean air are displayed at –1 log % (as this is around response measurement threshold). The equation and r2 of log-linear fits are indicated on the right. (B) Mean concentration-response curves of the linearly increasing (solid lines) versus tuned glomeruli (dashed lines). Glomeruli were grouped based on cluster analysis of the concentration-response pattern correlations (see Figures S1–S5 for detailed data).

