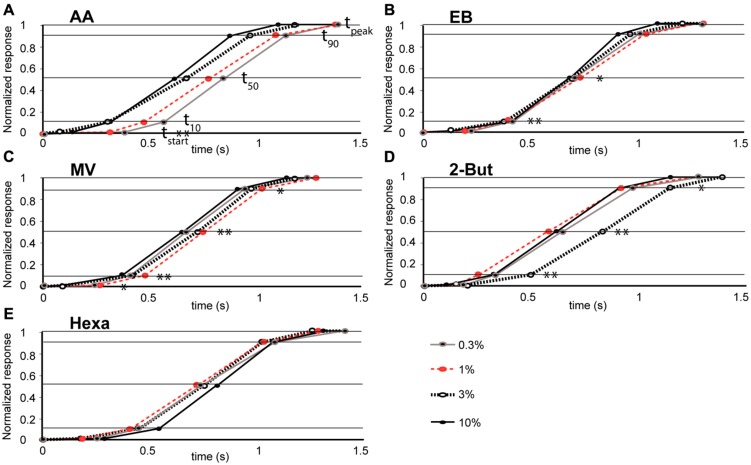
FIGURE 4.
Relationship between odor concentration and the mean time-course of retronasal odor responses (A–E). Stimulus onset time = 0 and other data points correspond to time constants (tstart, t10, t50, t90, tpeak marked by horizontal lines) for odorants, AA (n = 4 rats), EB (n = 8), MV (n = 5), Hexa (n = 7), and 2-But (n = 4) respectively. Significant effects of odor concentration on the dynamic parameters are marked. *P < 0.01, **P < 0.05, see Table 2 for ANOVA statistics.

