
Figure 8.
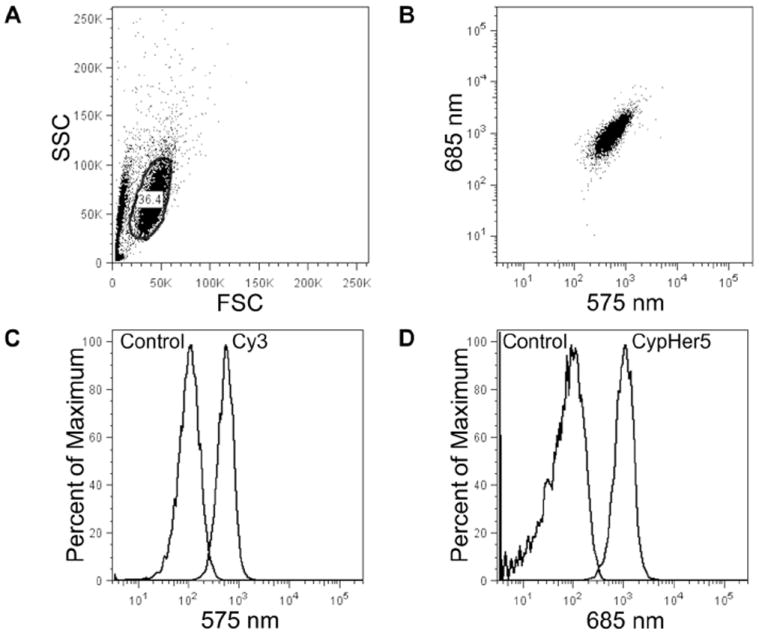
Flow cytometry of 9L cells labeled with ratiometric nanoemulsions. Representative FSC/SSC plot (A) and dot plot (B) for formulation 24; gated region marked by black line (A). Histograms are of live gated cells at (C) 575 nm for Cy3 and (D) 685 nm for CypHer5, and are overlaid control cells labeled with non-fluorescent nanoemulsion 23.