
Figure 1. Search engine comparison.
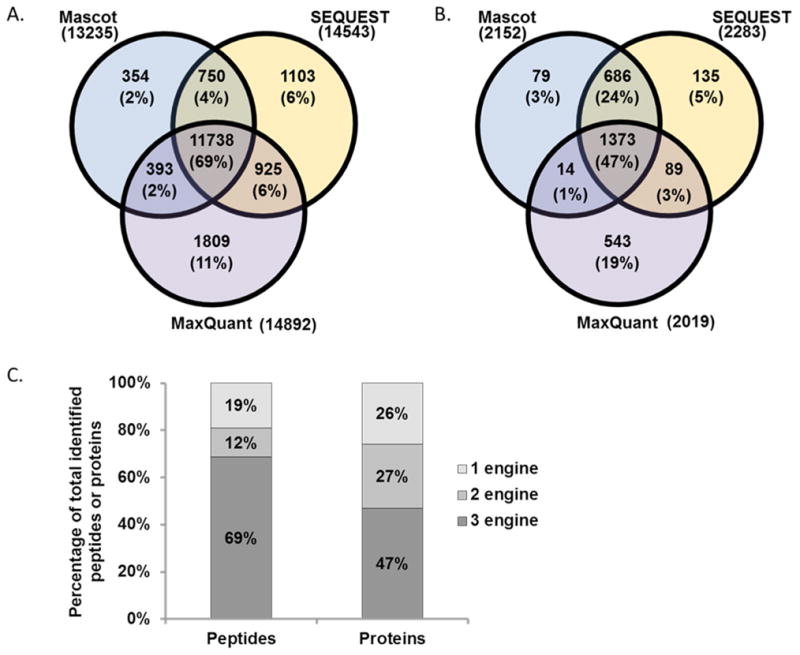
Venn diagrams comparing A) peptide identifications and B) protein identifications. C) Bar graph illustrating the redundancy of peptides and proteins identified by one, two, and three search engines
Official websites use .gov
A
.gov website belongs to an official
government organization in the United States.
Secure .gov websites use HTTPS
A lock (
) or https:// means you've safely
connected to the .gov website. Share sensitive
information only on official, secure websites.
Venn diagrams comparing A) peptide identifications and B) protein identifications. C) Bar graph illustrating the redundancy of peptides and proteins identified by one, two, and three search engines