Figure 4.
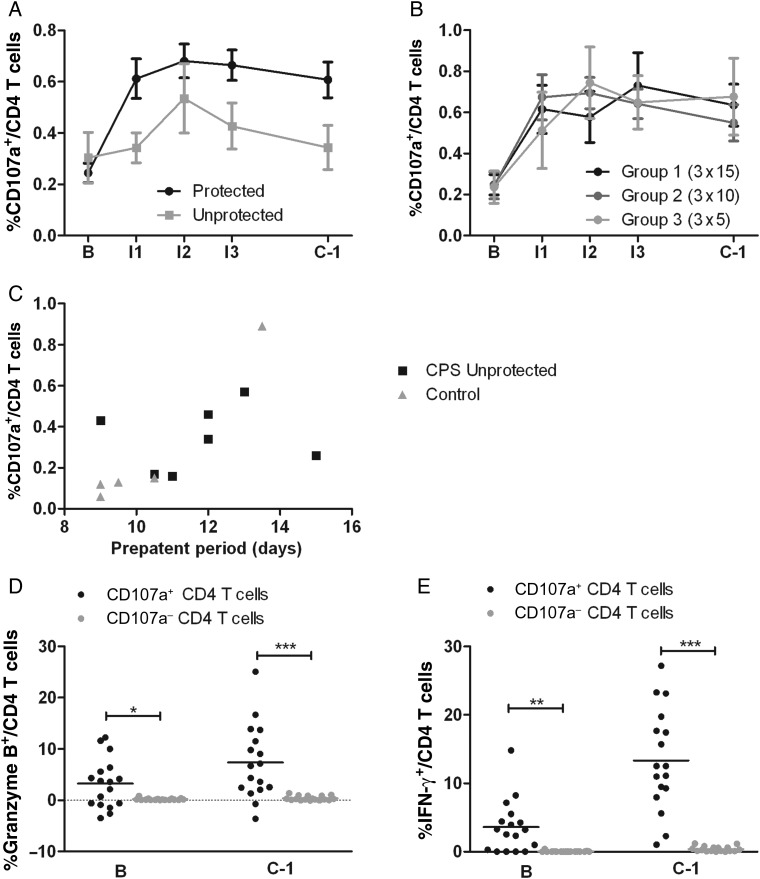
Cytotoxic profile of chemoprophylaxis and sporozoites (CPS)–induced CD4 T cells. A and B, Induction of Plasmodium falciparum–specific CD107a+ CD4 T cells was determined in protected and unprotected CPS-immunized subjects (A) and in protected subjects separated for each immunization dose (B) over the course of immunization. Horizontal bars and whiskers represent mean responses and standard errors of the mean. C, The relationship between P. falciparum–specific CD107a CD4 T cells on day 27 after immunization 1 (I1) and the prepatent period after challenge for all thick-smear-positive volunteers (CPS-immunized individuals and controls). D and E, Among protected CPS-immunized subjects, granzyme B (D) and interferon γ (IFN-γ) production (E) by CD107a+ (black dots) and CD107a− (gray dots) CD4 T cells were analyzed at baseline (B) and after CPS immunization (on the day before the challenge infection [C − 1]). Horizontal bars show the mean response. All data were corrected for uninfected red blood cell background for every volunteer at each time point. *P < .05, **P < .01, and ***P < .001. I2, 27 days after immunization 2; I3, 27 days after immunization 3.

