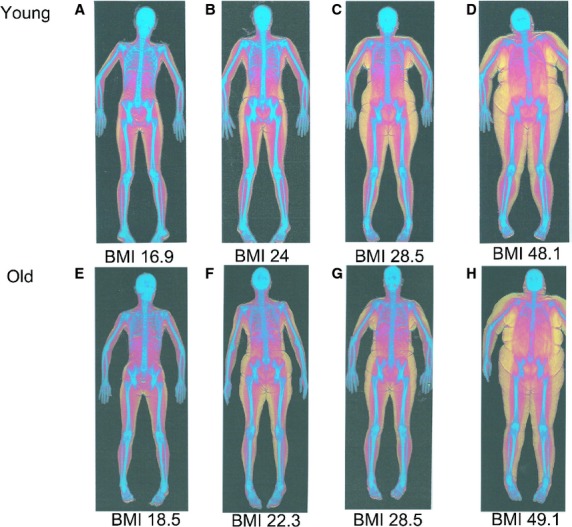
Figure 1.

Representative dual energy x‐ray absorptiometry (DEXA) scans of a (A) young underweight female, (B) young normal weight female, (C) young overweight female, (D) young obese female, (E) old underweight female, (F) old normal weight female, (G) old overweight female and (H) old obese female. Color key: blue for bone; red for lean tissue; yellow for adipose tissue.
