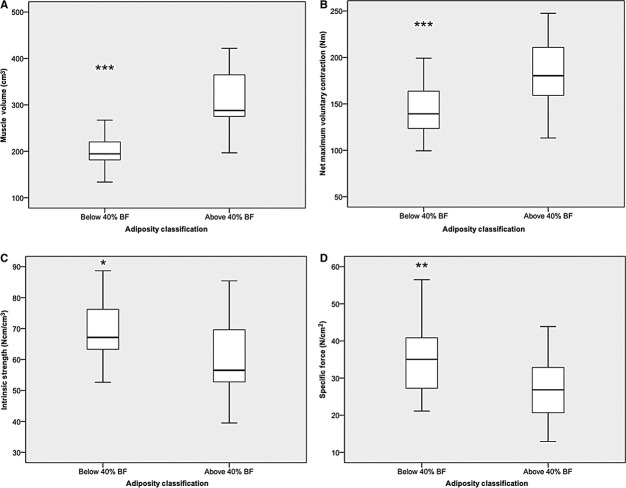
Figure 4.
Displays the impact of adiposity on (A) muscle volume (−1 overweight and 1 obese outliers), (B) net maximum voluntary contraction (−1 overweight outlier), (C) intrinsic strength (−3 underweight and 2 normal weight outliers) and (D) specific force (−1 underweight, 1 normal weight, and 1 overweight outliers) in young females (*P < 0.05; *P < 0.01; ***P < 0.001).

