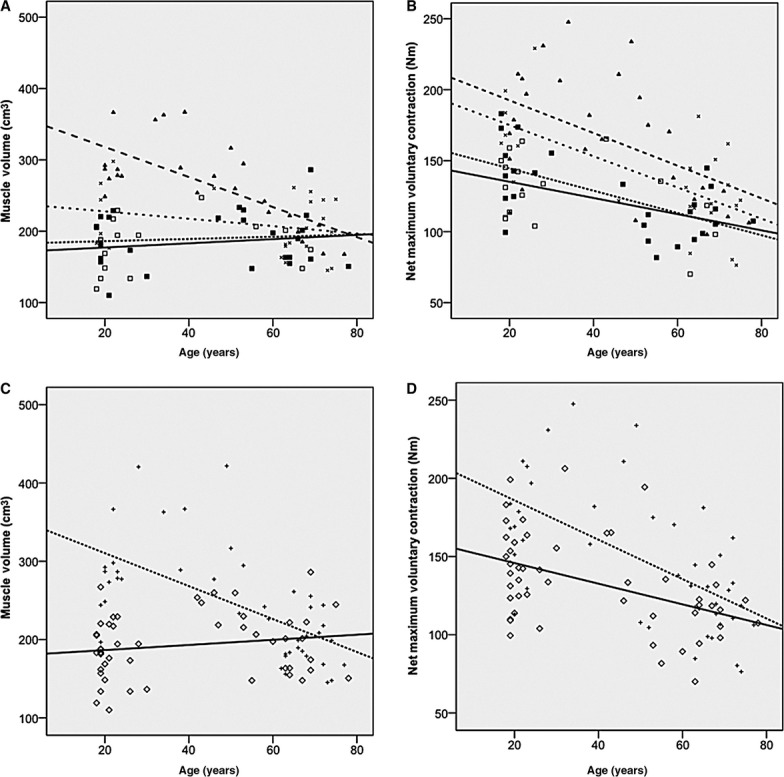
Figure 5.

Displays linear regressions (and slope comparisons) on the impact of age on both BMI and adiposity classification on muscle volume (A, C) and net maximum voluntary contraction (B, D) in sedentary females. (A) Underweight (□ ——) versus Obese (▲ — —) P <0.05. Normal weight (■ ‐ ‐ ‐ ‐ ‐) versus Obese; P <0.05. Overweight (× – – –) versus Obese P <0.05. (B) Underweight (□) versus Obese (▲) P >0.05; Normal weight (■) versus Obese; P >0.05; Overweight (×) versus Obese P >0.05. (C) Ordinary adipose ◊ ——; high adipose + ‐ ‐ ‐ ‐ ‐ P <0.05; (D) Ordinary adipose versus high adipose; P >0.05. Briefly, in terms of muscle volume, the obese individuals were shown to significantly decrease muscle mass per year at a fast rate (−2.1 cm3/year, P <0.001) than overweight (−0.5 cm3/year P = n.s), normal weight (0.2 cm3/year, P = n.s), underweight females (0.3 cm3/year, P = n.s) or ordinary adipose females (−2.1 cm3/year P <0.001 vs. −0.3 cm3/year P = n.s). In terms of nMVC, there was a (nonsignificant) trend for the obese individuals to lose maximum strength capability at a slightly greater rate (−1.2 Nm/year, P =0.019) than their overweight (−1.1 Nm/year, P =0.002), normal weight (0.8 Nm/year, P =0.008), underweight females (0.6 Nm/year, P = n.s) or ordinary adipose females counterparts (−1.3 Nm/year, P <0.001 vs. 0.7 Nm/year, P =0.001).
