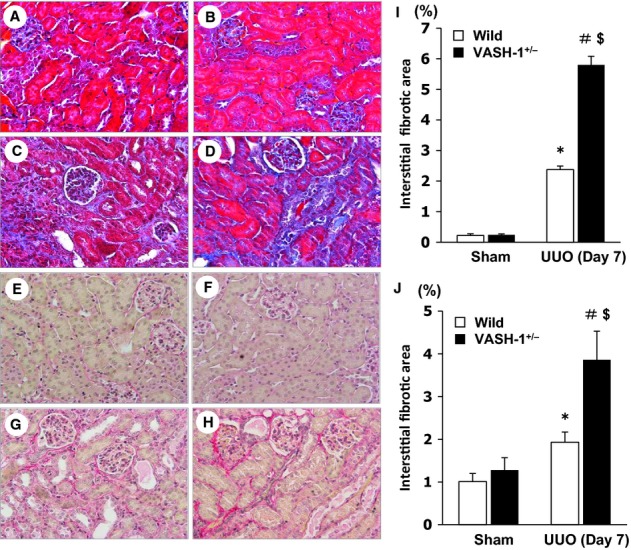
Figure 2.

Accelerated tubulointerstitial fibrosis in the VASH‐1+/− unilateral ureteral obstruction (UUO) mice. (A–D) Representative light microscopic findings of the renal cortex of the obstructed kidneys (OBK) on Day 7 (Masson's Trichrome staining, original magnification; ×400) for wild‐type (WT) sham‐operated (A), VASH1+/− sham‐operated (B), WT UUO (C) and VASH1+/− UUO (D) mice. (I) The interstitial fibrosis in the OBK was significantly exacerbated in the VASH1+/− UUO compared with the WT UUO mice. (E–H) Representative light microscopic findings of the renal cortex of the OBK on Day 7 (Sirius red staining, original magnification; ×400) for WT sham‐operated (E), VASH1+/− sham‐operated (F), WT UUO (G) and VASH1+/− UUO (H) mice. (J) The interstitial fibrosis in the OBK was significantly exacerbated in the VASH1+/− UUO compared with WT UUO mice. n =5 for each group. *P <0.05 versus WT sham. #P <0.05 versus VASH1+/− sham. $P <0.05 versus WT UUO. Each column shows the means ± SEM.
