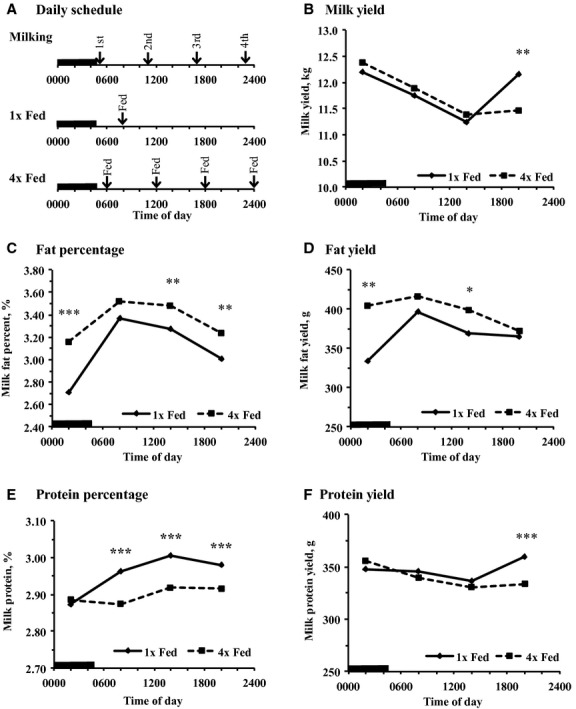
Figure 1.

Temporal pattern of milk yield and milk fat and protein yield and percent in cows fed once per day (1× Fed) or in four equal meals every 6 h (4× Fed). Cows were milked every 6 h and data are plotted at the median of the milking interval (MI). (A) Illustration of the timing of milking and feeding, (B) Milk yield (Treatment × Time P = 0.05; SEM = 0.42), (C) Milk fat percent (Treatment × Time P < 0.05; SEM = 0.15), (D) Milk fat yield (Treatment × Time P = 0.06; SEM = 23), (E) Milk protein percent (Treatment × Time P < 0.001; SEM = 0.03), (F) Milk protein yield (Treatment × Time P < 0.05; SEM = 12). Preplanned contrasts tested the effect of treatment at each milking (*P < 0.05, **P < 0.01, and ***P < 0.001). n = 17 per treatment. The black bar indicates the dark phase of the day.
