
Figure 5.
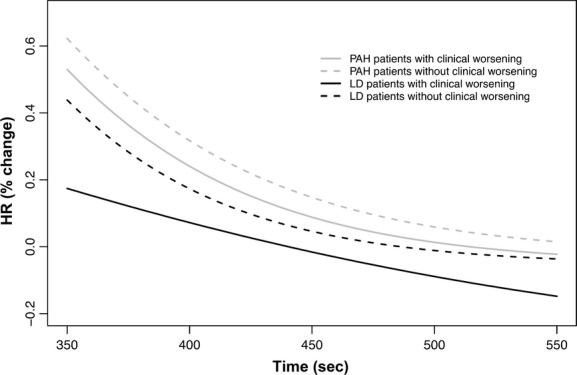
Nonlinear mixed model curves during the recovery phase of the 6‐min walk test (6MWT), contrasting patients with and without clinical worsening. X‐axis shows the time in seconds and the Y‐axis shows the percentage change in HR from the end of the walking phase. PAH, pulmonary arterial hypertension.