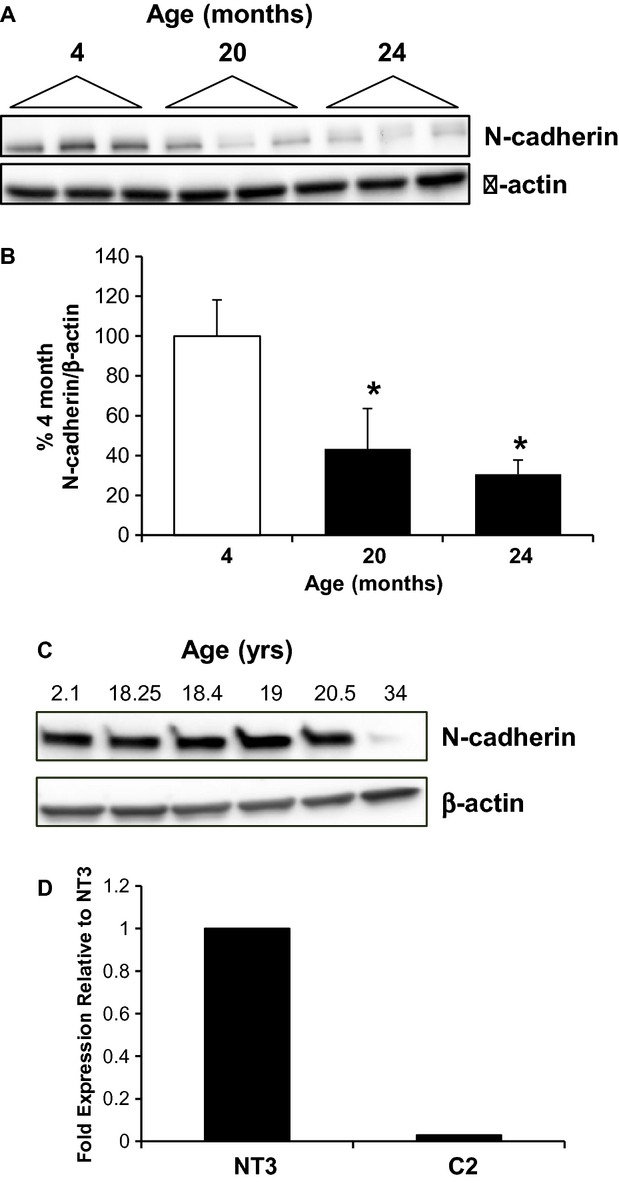
Figure 3.

Loss of α‐catenin expression decreases N‐cadherin expression. (A) A loss of N‐cadherin protein expression in cortical lysates from male Fischer 344 rats at 20, or 24 months is shown; each lane represents a sample from an individual animal. (B) Densitometric analysis of N‐cadherin expression, normalized to β‐actin; n = 3–7 animals, *indicates a significant difference from 4 months. (C) The age‐dependent loss of N‐cadherin is also seen in the aging nonhuman primate kidney, as shown by western blot of kidney lysates in the bottom panel. (D) The expression of Twist1 is decreased in C2 cells as compared to NT3 controls; similar results were seen in independent experiments.
