
Figure 5.
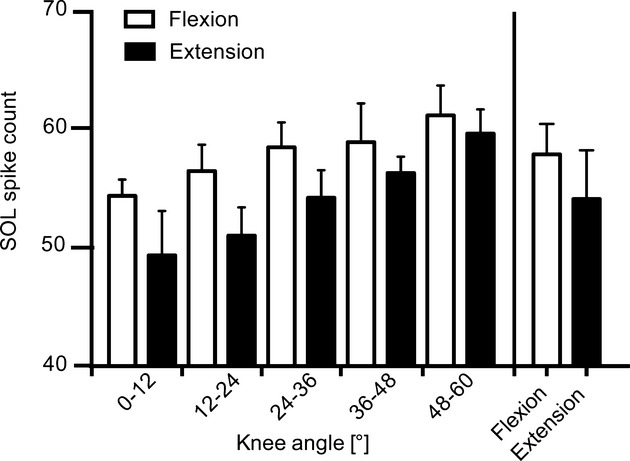
Group mean average of the soleus (SOL) activation: SOL activation was measured over 12° intervals by counting the total number of MU spikes within each bin for flexion (open bars) and extension (filled bars). Although not significant, the number of SOL spike counts was greater for flexion than extension for each interval. This was also the case for the mean count across each of the phases (bars furthest to the right).