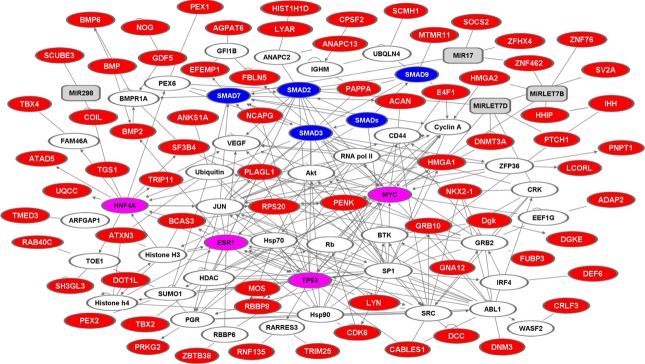
Figure 1.

Pathway analysis. Graphical representation of the height‐associated proteins relationships retrieved through SNOW network analysis. Proteins are represented as nodes (hubs), the biological relationships between the nodes (edges) are represented as lines. Height‐associated proteins are in red; linker proteins are in white; miRNA are in gray. Major hubs are in magenta; SMAD isoforms are in blue.
