
Figure 7.
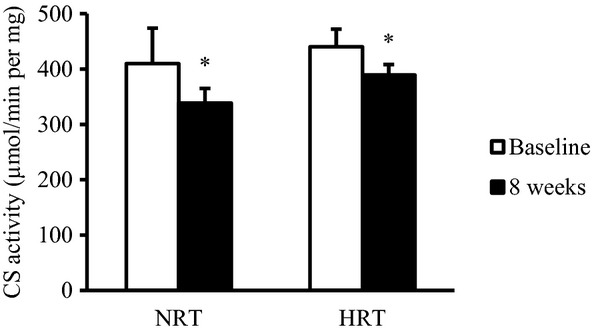
Change in citrate synthase (CS) activity before (baseline) and after (8 weeks) the resistance training program. NRT, normoxic resistance training (n =7); HRT, hypoxic resistance training (n =9). Values are represented as means ± SE. Significantly different from baseline: *P <0.05.