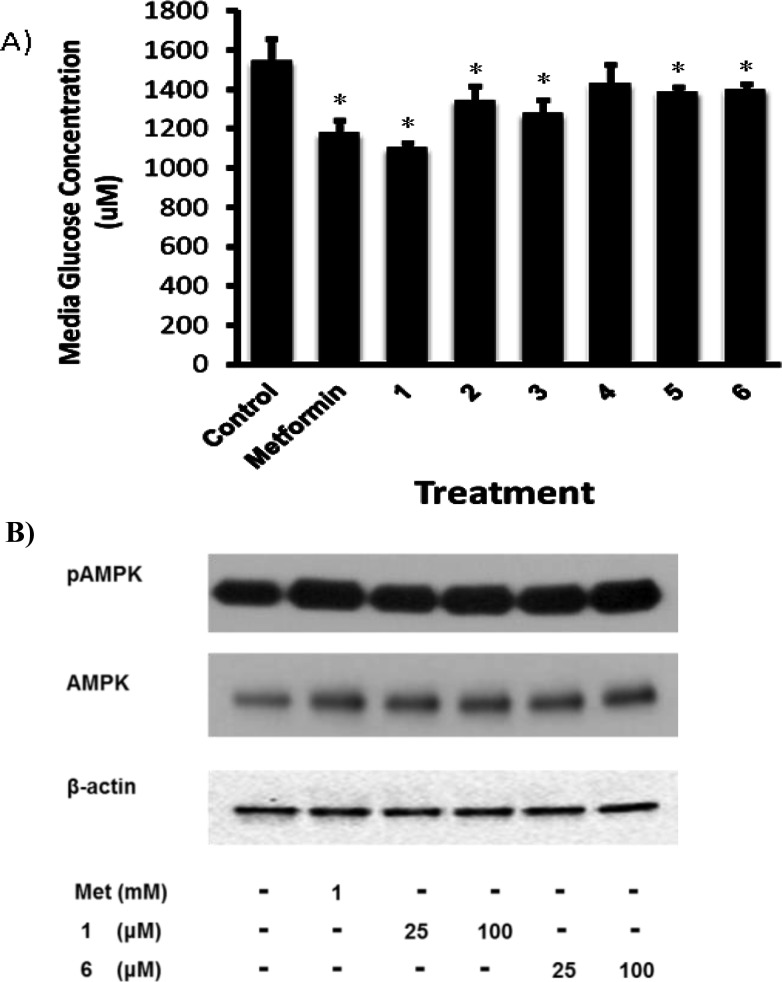
Figure 2.
(A) Effect of the isolates (at 25 μM) on glucose consumption in HepG2 cells. HepG2 cells were acclimated to a low-glucose DMEM overnight and then treated with the isolates or metformin in fresh media. Media was collected 7 h later, and glucose concentration was determined. The values are expressed as the means ± SD of three individual samples. *p < 0.05 as compared to the solvent control (0.1% DMSO). (B) AMPK phosphorylation status in HepG2 cells. HepG2 cells were incubated with metformin (Met) and compounds 1 and 6 (each at 25 and 100 μM, respectively) for 24 h, and then cell lysates were collected. Relative p-AMPK and total AMPK were measured by Western blot.

