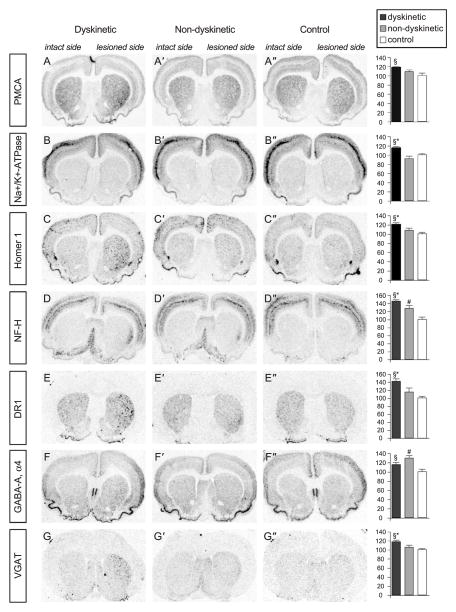
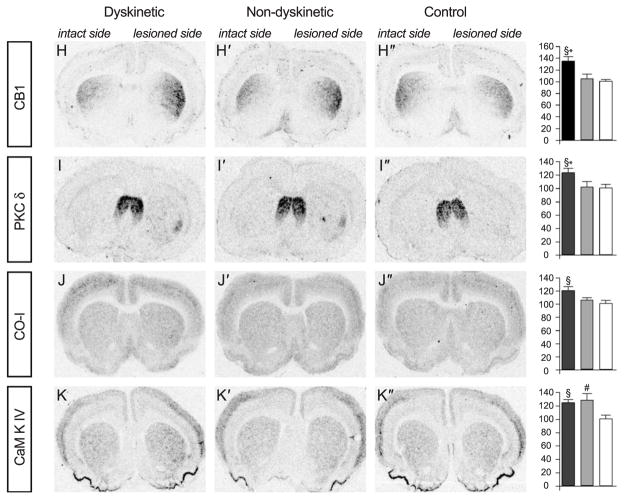
Fig. 3.
Gene changes validated by ISHH. The rows show film autoradiographs of striatal sections from dyskinetic rats, nondyskinetic rats, and control animals. Autoradiographs were obtained with the following probes: A, plasma membrane transporting ATPase 1 (PMCA1); B, the alpha1 subunit of Na+K+-ATPase (NaK-ATPase); C, homer 1; D, neurofilament heavy (NF-H); E, dopamine D1 receptor (DR1); F, α4 subunit of the GABA-A receptor (GABA-A α4); G, the vesicular GABA transporter (VGAT); H, the cannabinoid CB1 receptor (CB1); I, protein kinase C delta (PKCδ); J, cytochrome oxidase I (CO-I); K, calcium-calmodulin kinase IV (CamKIV). The results of the quantitative analysis (percent of control of lesioned side/unlesioned side) are shown in the column at right. P <0.05 for *, dyskinetic versus nondyskinetic; §, dyskinetic versus saline; #, nondyskinetic versus control.


