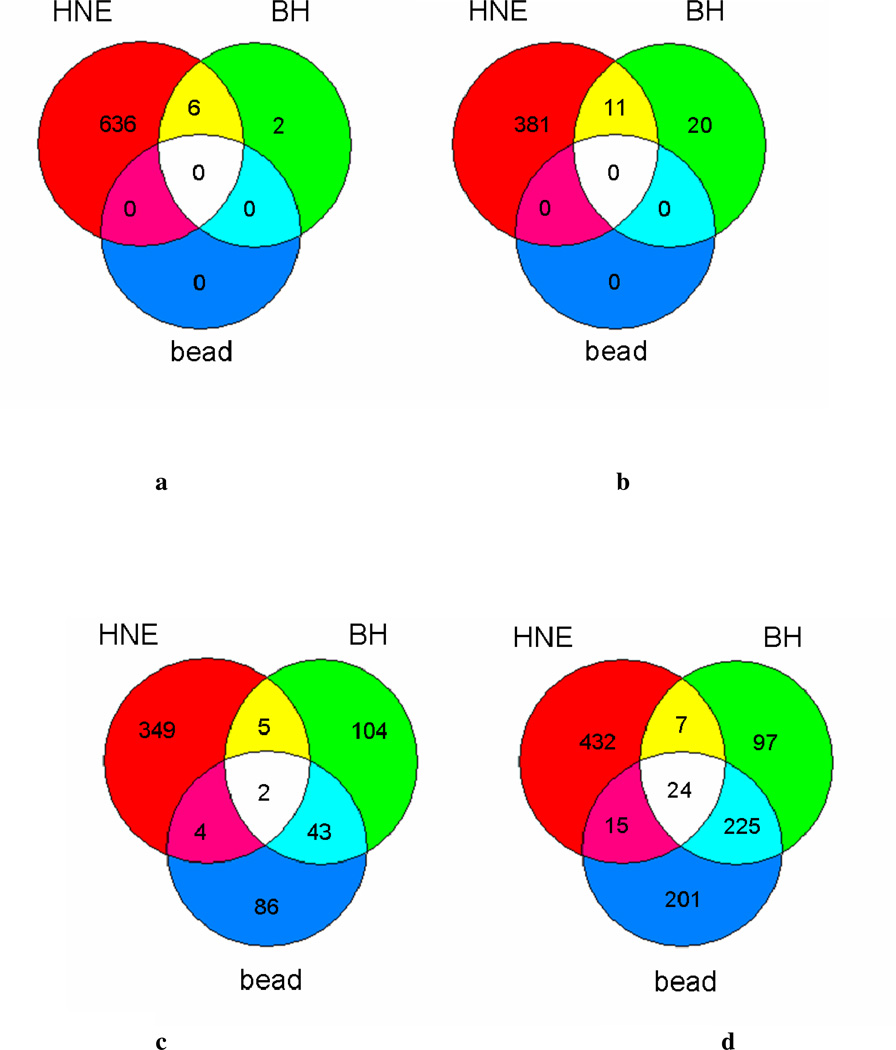
Figure 1.
Overlapping genes with significant differential expression mediated by BH and HNE. Venn diagrams show the intersection of genes that were altered by 0.1 mg/mL BH with those altered by either latex bead or 35 µM HNE treatment. Numbers represent statistically significant (p ≤ 0.01) genes up- or down-regulated ≥1.8-fold relative to LPS stimulated cells at 24 h. (a) down-regulated genes identified at 6 h, (b) up-regulated genes identified at 6 h, (c) down-regulated genes identified at 24 h, (d) up-regulated genes identified at 24 h.

