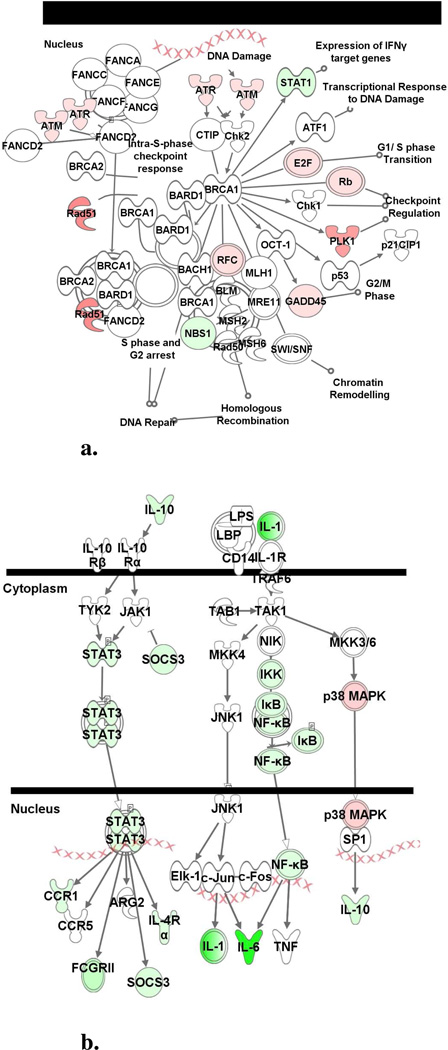
Figure 4.
Ingenuity canonical pathway analysis. Differentially expressed genes were mapped to the Ingenuity Canonical Pathway library to identify significantly altered canonical signaling pathways. (a) ‘IL-10 Signaling’ and (b) ‘Role of BRCA1 in DNA Damage Response’ were influenced by 35 µM HNE at 24 h and 6 h, respectively. Genes or gene products are represented as nodes and the intensity of the node color indicates the degree of up- (red) or down- (green) regulation.

