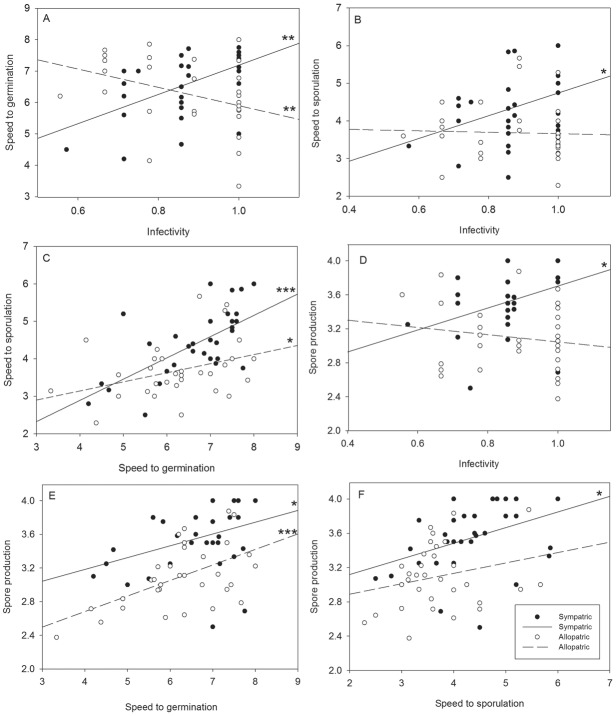
Figure 1.
Life-history trait correlations of the 33 Podosphaera plantaginis strains measured on sympatric host genotypes (black symbols, solid line) and allopatric host genotypes (white symbols, dashed line). The significance of the slopes are indicated with asterisks (*P ≤ 0.05, **P ≤ 0.01, and ***P ≤ 0.001). For those life-history traits that depict timing of events (i.e., speed to germination and speed to sporulation), higher values indicate faster performance.

