
Figure 7.
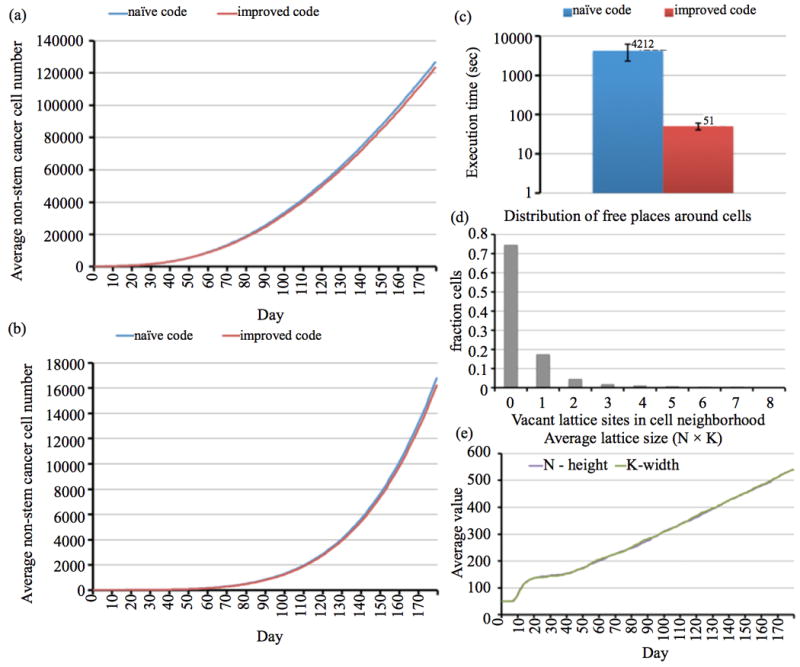
Model results for simulating 180 days of tumor growth initiated by one cancer stem cell. Naïve (blue curve) and improved (red) code simulate comparable tumor growth dynamics with similar non-stem cancer cell (a) and cancer stem cell (b) numbers; (c) Average simulation times and standard deviations; (d) Distribution of vacant lattice sites in cell neighborhood at final simulation time point; (e) Evolution of average lattice size in the improved code. Initial lattice size 50 × 50, final lattice size 550 × 550. Shown are averages (standard deviations omitted in most panels for clarity) for N = 100 (improved code) and N = 77 (naïve) independent simulations.