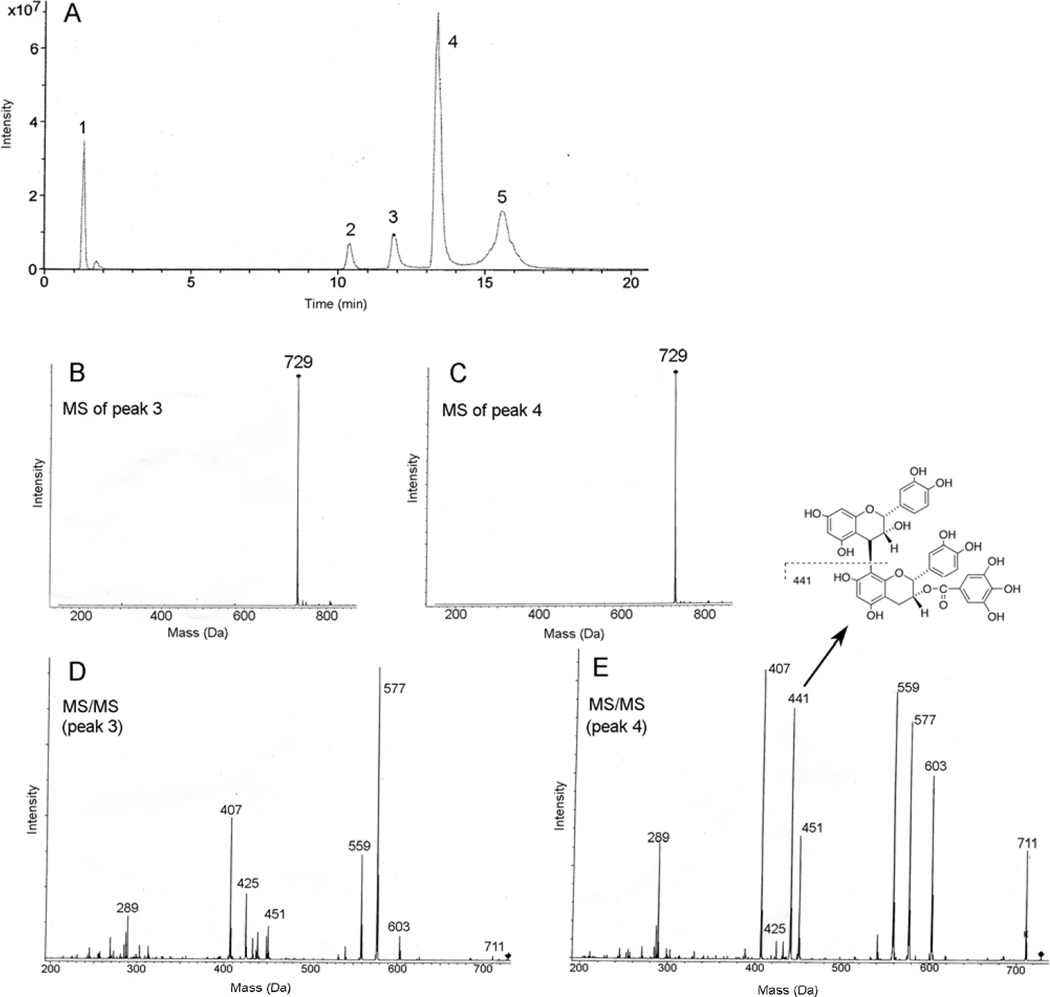
Fig. 2.
Negative ion LC-MS studies of hydrolysis products formed from B2-G2. A) Total ion current chromatogram of products from the partial enzymatic hydrolysis of B2-G2. Peaks 1, 2 and 5 correspond to gallic acid, B2 and B2G2, respectively, by comparison with authentic standards. B) MS spectrum of peak 3 and C) MS spectrum of peak 4, both demonstrating a deprotonated molecular ion (M – H)− at 729 Da. D) MS/MS spectrum of the 729 ion from peak 3. E) MS/MS spectrum of the 729 ion from peak 4. The unique ion at 441 Da corresponds to interflavin bond cleavage and charge retention the lower unit as shown.

