
Figure 1.
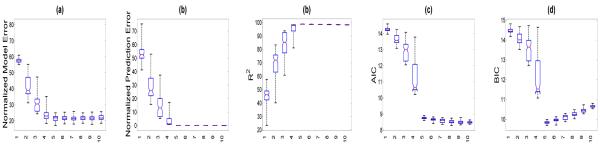
Simulation results: the box plots of five selection criteria including , , , AIC, and BIC against rank r from the left to the right based on 100 simulated data sets simulated from model (4) with (n, p, d) = (100, 200, 100) and the true rank r0 = 5.