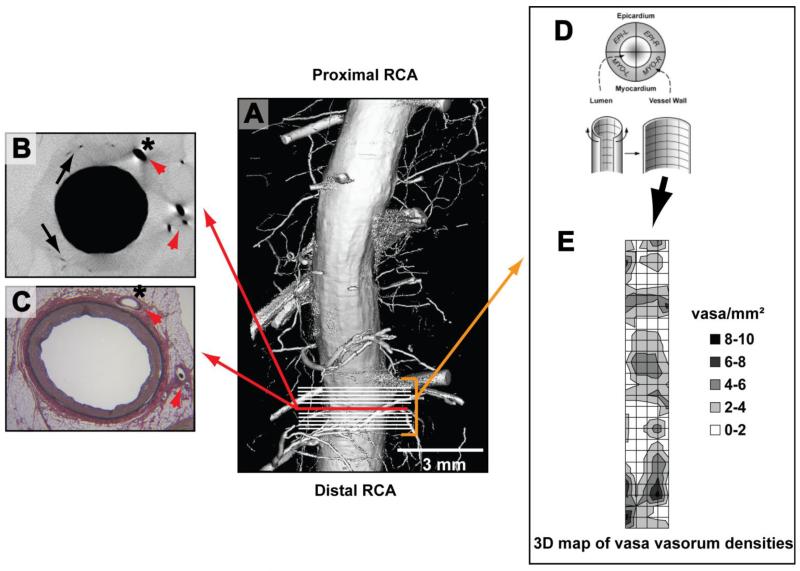
Figure 1. Methods.
Panel A is a computer-generated surface display of a coronary artery lumen and its branches scanned with micro-CT. The upper-left panel B is a micro-CT cross-sectional image of that coronary and panel C is the corresponding Lawson’s Elastic van Gieson stained histology cross-section (the close match is appreciable by corresponding anatomical landmarks in both images [red arrow heads]). Vasa vasorum (black arrows) are differentiated from myocardial branches (*) by manually tracing the origin and destination of the vessels in hundreds of consecutive micro-CT images of the coronary. Next, vasa vasorum densities (vasa/mm2) are calculated in all four vessel wall quadrants (panel D; EPI-L stands for epicardial left quadrant) in ten, consecutive micro-CT cross sections (indicated by white lines in panel A) that are adjacent to the cross-section from panel B. Panel E: Calculated vasa vasorum densities (0 to 10 vasa vasorum per quadrant as indicated by the color-coded legend) are then displayed in a 3D map of vasa vasorum densities referenced to the endothelial surface 4. The patchy spatial distribution of high and low vasa vasorum densities is reminiscent of the patchy distribution of atherosclerotic plaques. Finally, vasa vasorum densities and quantitative histology data (intima-media ratios and the number NF-κB and HIF-1α positive cells from three high-power fields per vessel wall quadrant) are correlated.

