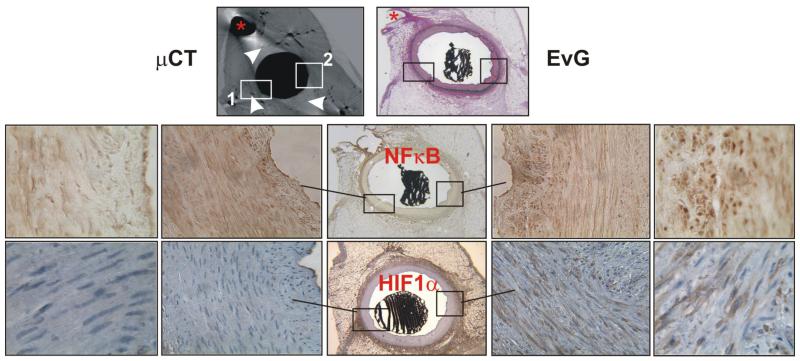
Figure 2.
Representative examples of corresponding micro-CT, Elastic van Gieson (EVG), NF-κB, and HIF-1α slides. Anatomical landmarks (*) helped to find corresponding slides. Two areas (white boxes, 1 and 2) from two different vessel wall quadrants are indicated in the micro-CT image and can be followed in the corresponding histological sections (sections stained for NF-κB and HIF-1α correspond to the upper micro CT and EVG sections; EVG, NF-κB and HIF-1α sections are adjacent to each other). (1) represents an area with a higher vasa vasorum density and shows less NF-κB and HIF-1α positive cells than (2) which represents an area with a lower vasa vasorum density. Vasa vasorum are shown as small black dots in the micro-CT cross-section because they are filled with contrast, the white arrowheads point at vasa vasorum; see also Figure 1. Magnifications, ×2, ×40, and ×125.

