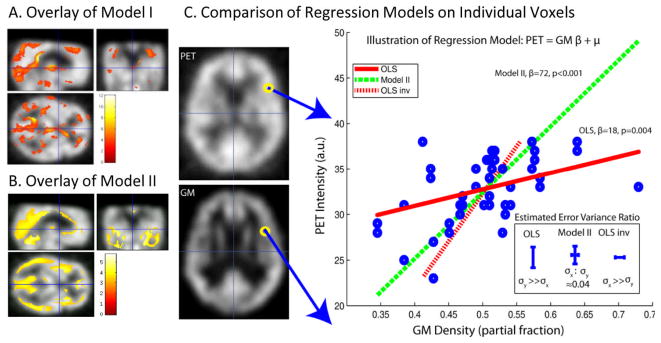
Figure 3.

Model II and Model I (OLS) multi-modality regression analysis. Model I (A) and Model II (B) lead to distinct patterns of significant differences (p<0.001, uncorrected) when applied to identical empirical datasets and association models. Inspection of single voxel: PET vs Grey Matter MRI (GM) illustrates the reasons for the different findings (C). The GLM model used for the forward mapping is y = xrβr + β1, where y represents PET image intensity and xr represents GM normalized image intensity. On the left-hand side of (C), example images of PET and GM are shown, along with the location of the single example voxel whose regression analysis is displayed in the right-hand plot. The individual data points (blue circles) were fit using OLS (red lines) and Model II regression (green dashed line). The inverse mapping for OLS (red dash) is unique from the forward mapping (red full). The Model II mapping was found to be reversible and can be represented by the same line. Resulting error bars and corresponding σx:σy value estimates are compared between OLS and Model II in the lower right-hand insert.
