
Figure 1. Resting state networks of interest.
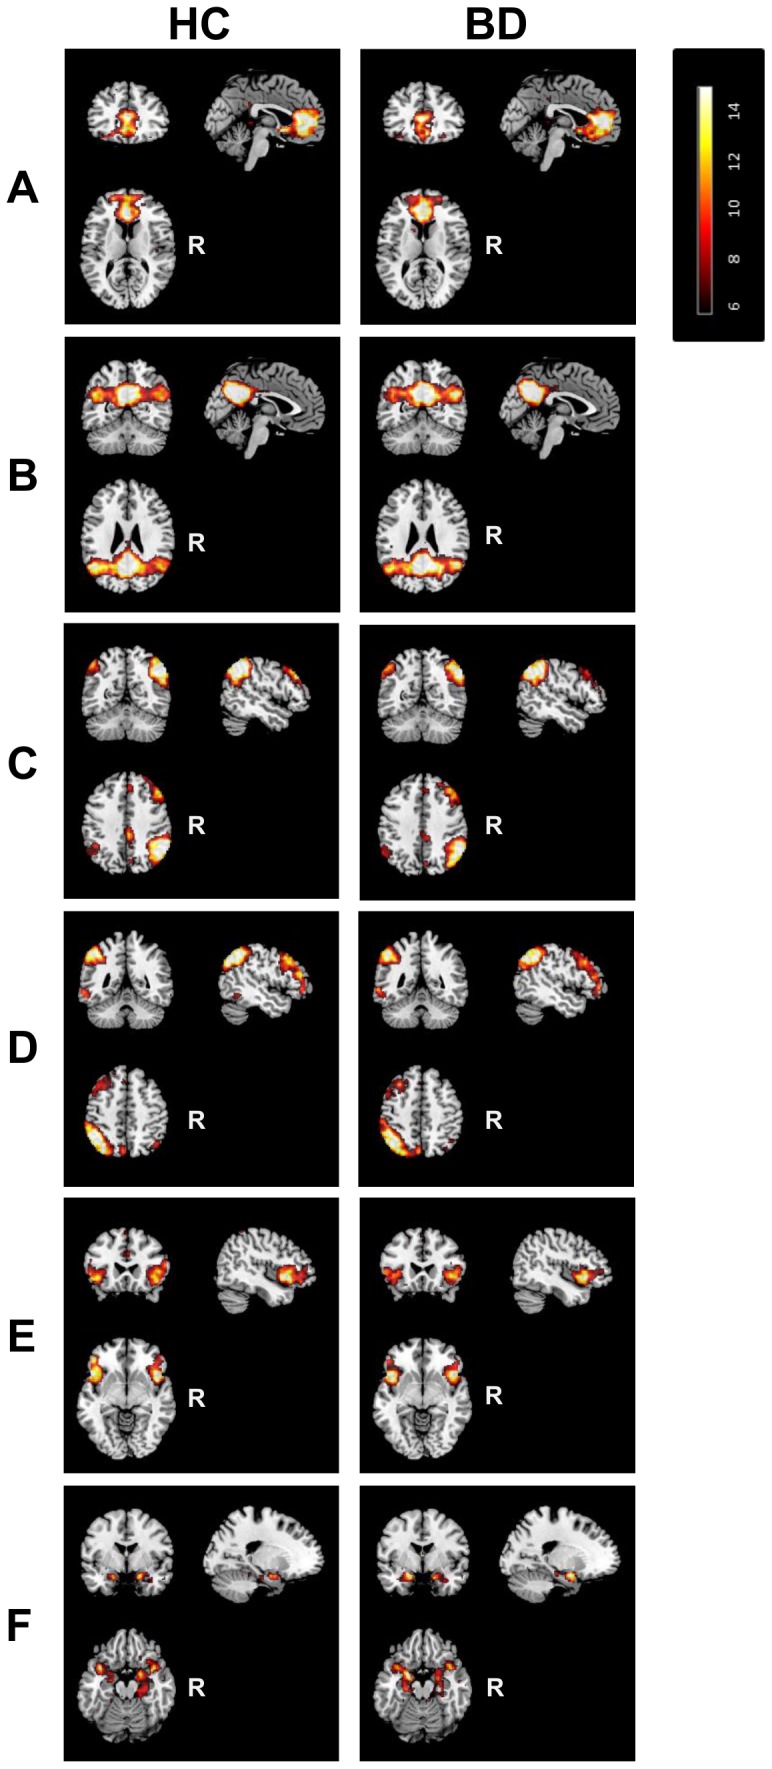
Illustration of one-sample-t-test maps of the anterior and posterior default mode network, right and left frontoparietal network, the salience network, and the meso/paralimbic network identified in the control (left column) and patient (right column) group. Maps are thresholded at P<0.05 (whole-brain FWE corrected). R, Right.