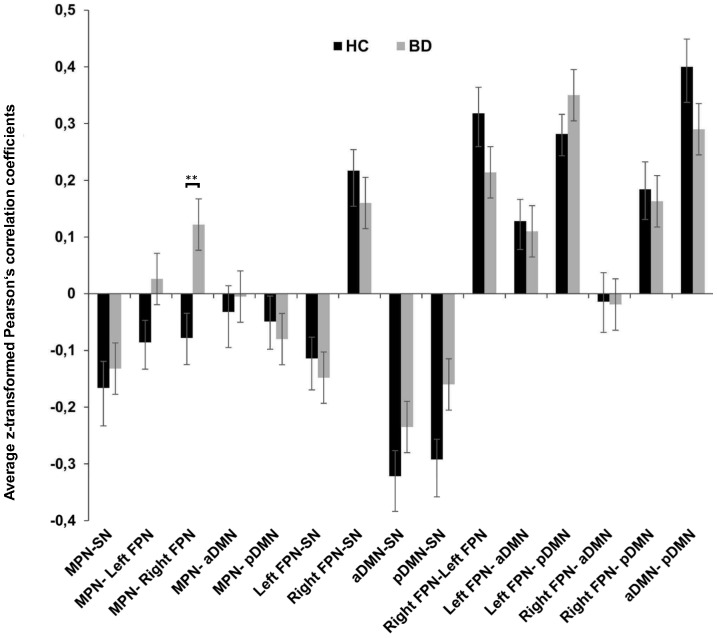
Figure 2. Functional network connectivity (FNC) between components.
Average Fisher's z-transformed Pearson's correlation coefficients from FNC analysis reflecting connectivity between the 6 components of interest (15 possible pairs of components) for the healthy control (HC) and patient group (BD). Error bars represent the standard error of the mean (SEM). Asterisks (**) depict FDR significant finding.

