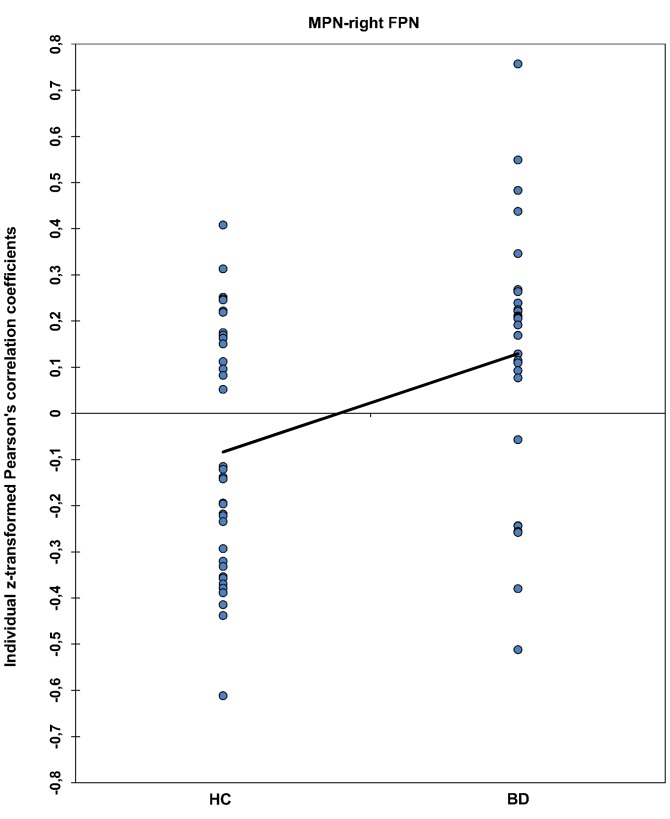
Figure 3. Functional network connectivity (FNC) between MPN-right FPN in the individual level.
Fisher's z-transformed Pearson's correlation coefficients depicting individual FNC values for the MPN-right FPN pair. Both samples are normally distributed and have equal variance. The line connects the average FNC values of the two groups.

