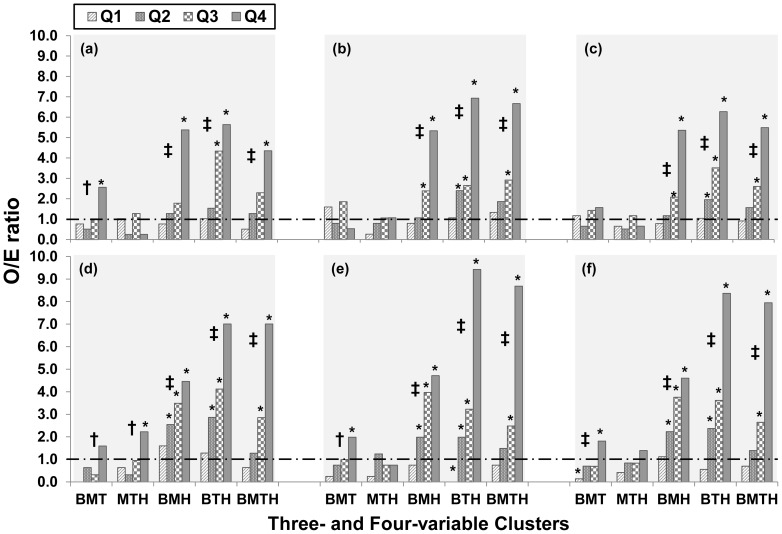
Figure 2. Observed to expected (O/E) ratio of clustering patterns of MetS components by uric acid quartiles (Q) in children and adults.
(a) boys; (b) girls; (c) all children; (d) males adults; (e) female adults; (f) all adults. BMT = BMI, MAP and TG/HDLC; MTH = MAP, TG/HDLC and HOMA; BMH = BMI, MAP and HOMA; BTH = BMI, TG/HDLC and HOMA; BMTH = BMI, MAP, TG/HDLC and HOMA. *, O/E ratios are significantly different from 1 (p<0.05). †, p for trend <0.05. ‡, p for trend <0.001.

