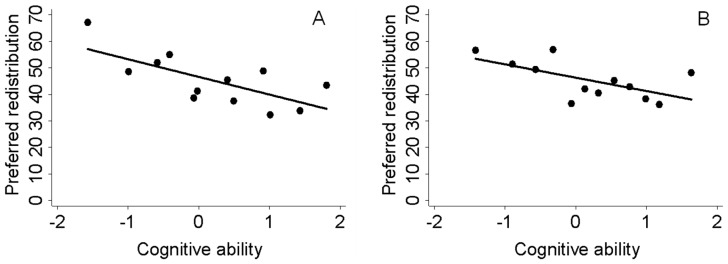
Figure 1. Cognitive ability and demand for redistribution.
Visual representation of the relation between cognitive ability and demand for redistribution. Preferred redistribution defined as in text, ranging from no (0 percent) to full (100 percent) redistribution. Cognitive ability scaled to have mean 0 and sd 1 in the sample of all enlisters. We rank individuals according to cognitive ability and construct twelve equal-sized bins. The figures show mean redistribution against mean cognitive ability in each bin. N = 271. Panel A: Raw correlation. Panel B: Controlling for age, for whether subject continued from primary to secondary school, and for socio-economic status during childhood (answer to question “How would you classify yourself in terms of class when you grew up?” with alternatives “Working class”, “Lower middle class”, “Middle class”, “Upper middle class”, “Upper class”). To obtain this figure we first regress demand for redistribution on these control variables. We then add the mean of the demand for redistribution variable to the residuals obtained from that regression and plot this variable against cognitive ability.

