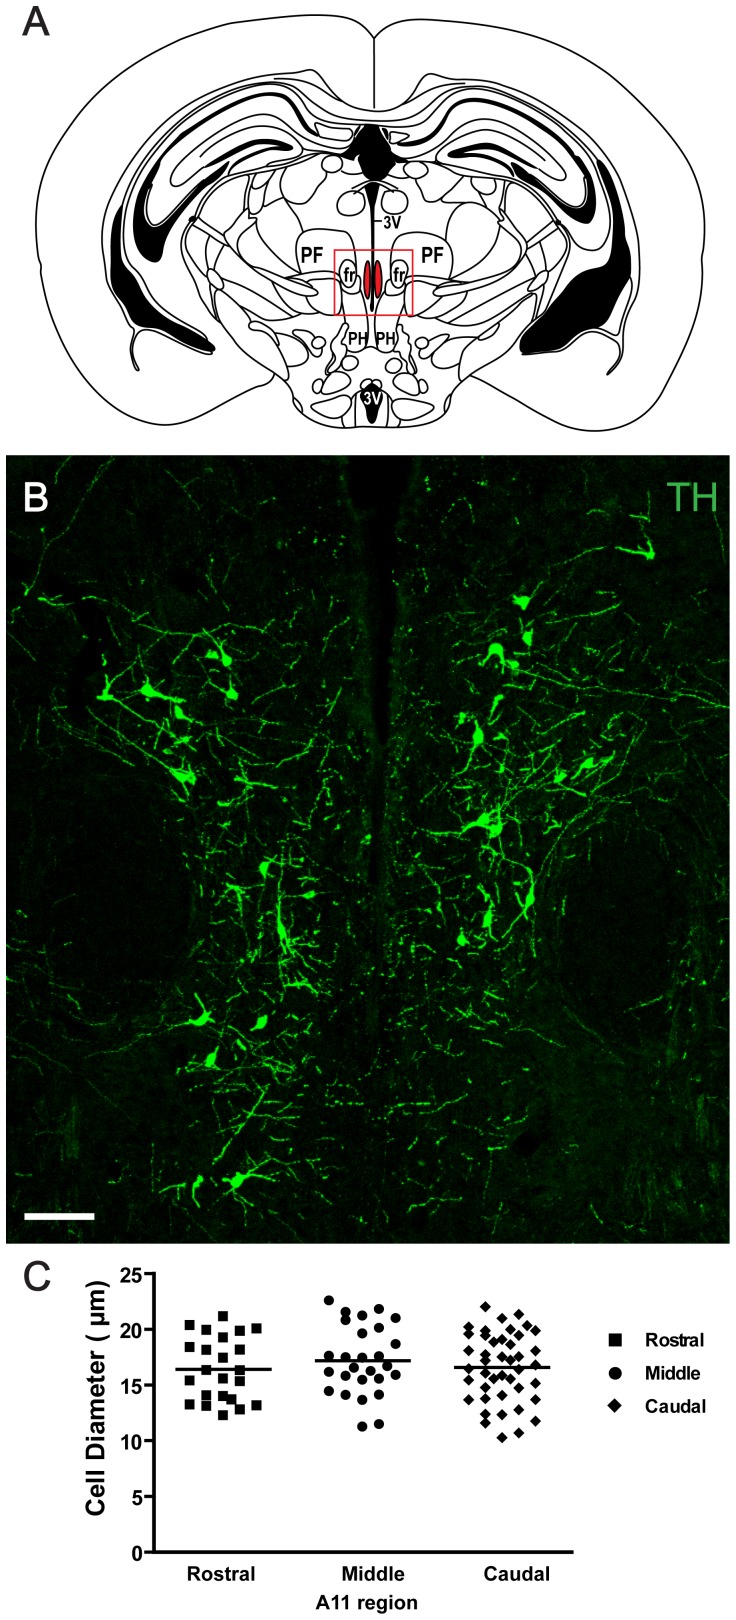
Figure 1. Characterization of tyrosine hydroxylase (TH) positive cells in A11.
A: Diagram showing the middle region of the A11 area in the mouse. The red frame represents the area where representative micrographs were taken. The diagram was adapted from [24] with permission. B: TH immunohistochemistry (green) of the middle region of A11. Scale bar 100 µm. 3 V = third ventricle, PF = parafascicular thalamic nucleus, fr = fasciculus retroflexus, PH = posterior hypothalamic nucleus, mt = mammillothalamic tract. C: Diameter of TH positive cells in three regions - rostral (AP −2.0 mm), middle (AP −2.3 mm) and caudal region (AP −2.5 mm). The mean cell diameter was 16.7±0.3 µm and the cell diameters between sections were similar.

